BCOME


MEASURING TO IMPROVE
To protect the planet, we first need to understand precisely how we impact it. That is why, since 2020, Ecoalf has been working with BCome, an independent platform specializing in impact analysis.
Together, we measure and trace the journey of every garment, from raw material extraction to its arrival at our warehouse. Because we don’t believe in intuition or empty promises. We believe in data, science and traceability as the best way to fight greenwashing.

HOW DO WE MEASURE THE IMPACT OF OUR GARMENTS?
To understand the impact our garments have on the planet, BCome applies a scientific system called Life Cycle Assessment (LCA). It provides a complete picture of the environmental history of each product. We don’t just look at what happens in the final factory. We measure impact from the very first stage of the supply chain.
OUR SCOPE: “CRADLE-TO-GATE”
Our measurement follows the “Cradle-to-Gate” approach. This means that the LCA traces every environmental impact that occurs throughout the garment’s journey:
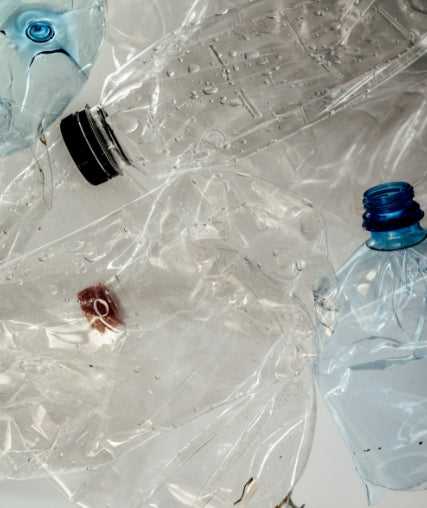
1. Origin
From the extraction of the raw materials themselves, such as cotton, recycled materials, etc.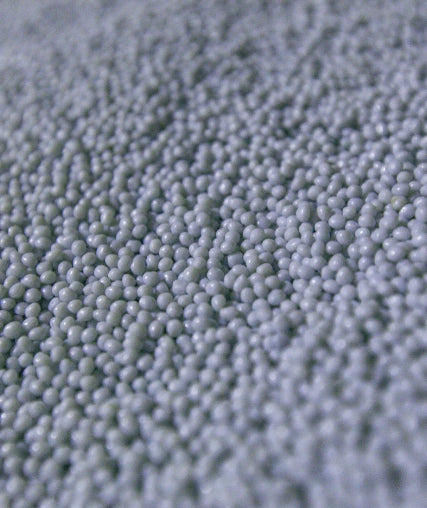
2. Processing
Weaving, dyeing, printing and treatments.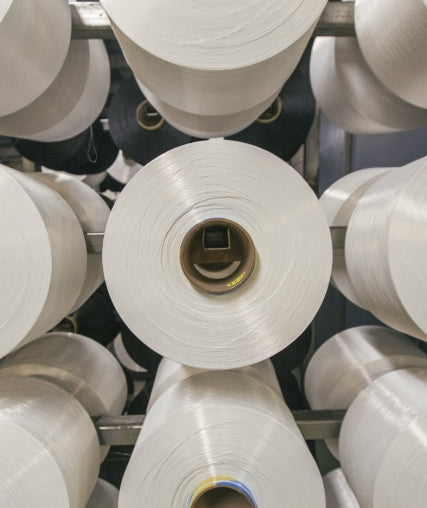
3. Production
The construction and manufacturing of the garment.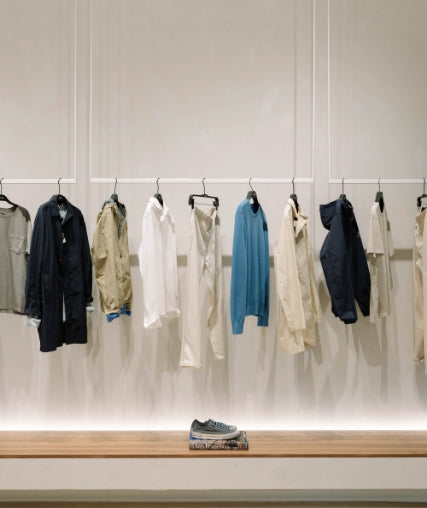
4. Destination
Up to the point when the finished product arrives at our warehouse.
ASSUMPTIONS, DATA AND LIMITATIONS: OUR COMMITMENT TO HIDING NOTHING
An LCA requires a huge amount of data to be accurate. Where does it come from?
Real and verified data.
We map the supply chain from Tier 1 (manufacturing) to Tier 4 (raw materials). BCome uses verified and up-to-date databases, following international standards such as ISO 14040/14044.
The limitation
and our golden rule.Sometimes supply chains are so complex that obtaining 100% of the information from a supplier is difficult. So what do we do when data is missing? We apply the most conservative and strict scenario. We would rather assume that the impact was higher than make the results look better than they really are.
Functional unit.
To make the data comparable, we standardize the results based on the production of a single garment, for example a size M, an accessory or a pair of shoes.


These include:
Water scarcity.
Global warming
(carbon emissions).
Fine particulate matter
(emissions that affect air quality).
The use of fossil and non-renewable resources.
Having these 16 indicators allows us to see the full picture and make strategic decisions so that our future collections can be even more respectful of the planet.
WHAT DO WE MEAN WHEN WE SHOW “ENVIRONMENTAL SAVINGS”?
To calculate whether a garment has actually resulted in an “environmental saving” or, on the contrary, an “environmental debt,” we cannot measure its impact in isolation. We need to compare it against the industry standard.

